Problem
Municipal budgets are dense, technical documents that are difficult for residents and even town officials to navigate. Arlington needed a way to make its financial data understandable, transparent, and useful for public decision-making. What if a town budget could be explored like a map—interactive, visual, and intuitive?
Solution
We designed and built an interactive visual budget that transforms Arlington’s financial data into a dynamic, explorable interface and made it open source so any city can use it to transform their financial transparency.
Results
- 15+ Municipalities adopted AVB
- 2 Major design awards
- $40K State grant awarded
Awards
- Design F Award
- Innovation Award by Mass Municipal Association
- Voice of Transparency Government - The Sunlight Foundation
Overview
Every spring, Arlington's Finance Committee sends the town's budget to a representative Town Meeting where it is debated, amended, and eventually approved. The data had long been technically open — available to any resident who sought it out — yet even citizens with financial backgrounds struggled to make sense of dense tables and static PDFs.
The Town needed something new: a product that could tell the financial story of a municipality in a way that hadn't been attempted before. GoInvo (then operating as Involution Studios) donated the full design and engineering effort, working directly with Arlington's town staff to build the first known municipal budget visualization of its kind.
The Challenge
In early March 2013, GoInvo began working with Andrew Flanagan, Mike Bouton, Annie LaCourt, and Alan Jones from Arlington's town staff. The brief was clear and ambitious: imagine a completely new way to represent their financial data.
Arlington had conducted a public survey on how it communicated financial information. Residents overwhelmingly responded that they wanted more concise online information. They weren't getting it. Budget documents were thorough — and impenetrable.
Increasing transparency and accessibility to financial information has long been a goal for the Town.
Adam Chapdelaine
Arlington Town Manager
The challenge ran deeper than presentation. The budget data itself is hierarchical: a department like DPW breaks down into personnel and expenses; personnel further splits into salaries, overtime, and benefits. Any visualization would need to honor that structure without burying the detail or losing the big picture.
- Budget data was difficult to navigate and compare
- Residents had limited visibility into spending decisions
- Public discussions lacked a shared, intuitive understanding of the numbers
The town needed a way to make its budget not just available—but understandable.
Design Process
The process was iterative and, in places, humbling. What the team thought would work didn't — and the detour turned out to be the lesson.
Start with a blank canvas
GoInvo had not worked in civic budget visualization before. That was an advantage. There were no entrenched assumptions — the team could explore freely from first principles alongside the Arlington staff.
An early design that didn't survive real data
The first promising concept was a zoomable partition layout — highly interactive, clearly articulating the hierarchy of each budget layer. The team loved it. Then they loaded the actual data. Because some figures were very large and others tiny, the visualization collapsed under the weight of the disparity. Data more than two layers deep became invisible at any useful size.
Reframe: design for the data, not just the user
The team had been trained to center the user. This project demanded something additional — centering the content itself. The numbers had to be treated as first-class participants in the design, not just the payload to be delivered.
Explore, critique, and converge
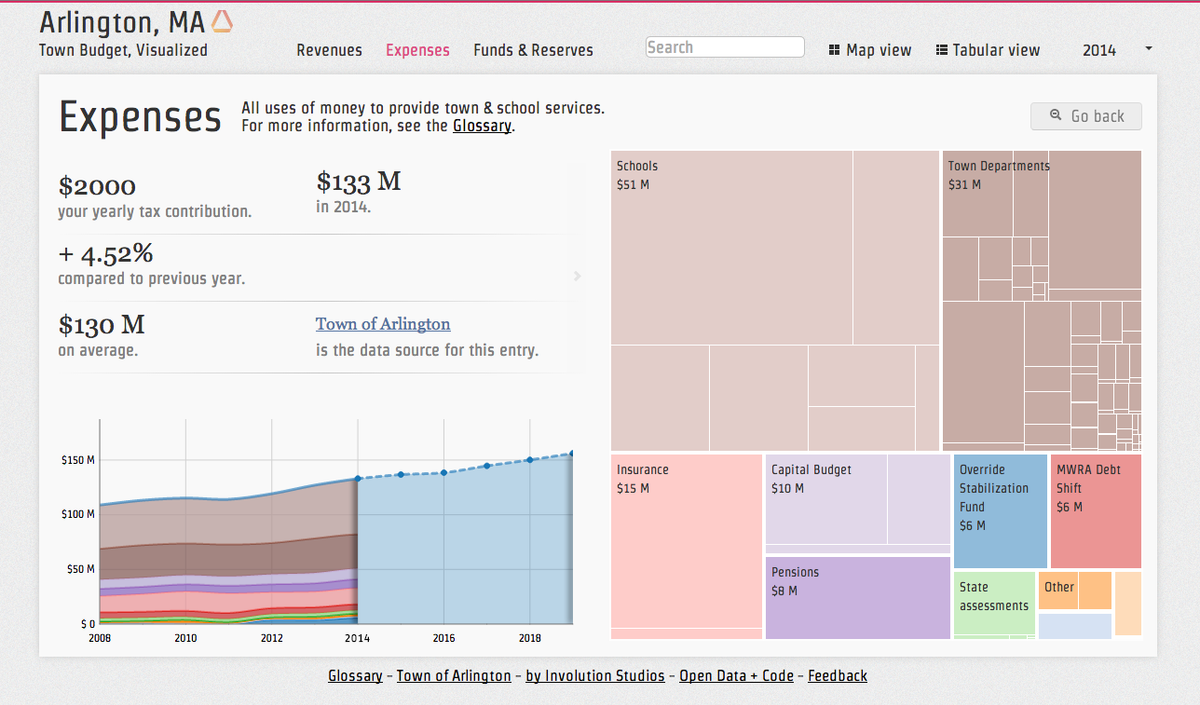
The team tried Sankey charts and bubble charts and sought outside critique from Katy Harris at Fathom, whose feedback sharpened their thinking. They eventually landed on treemaps — a technique pioneered by Professor Ben Shneiderman — which proved both intuitive and honest to the data's scale.
The right structure for the story
Treemaps allowed users to zoom into deeper layers to see small figures and zoom back out to see the financial plan as a whole. Crucially, both large and small numbers remained legible at every level — the data could be read accurately down to its finest detail.
The Solution
A budget that tells its own story
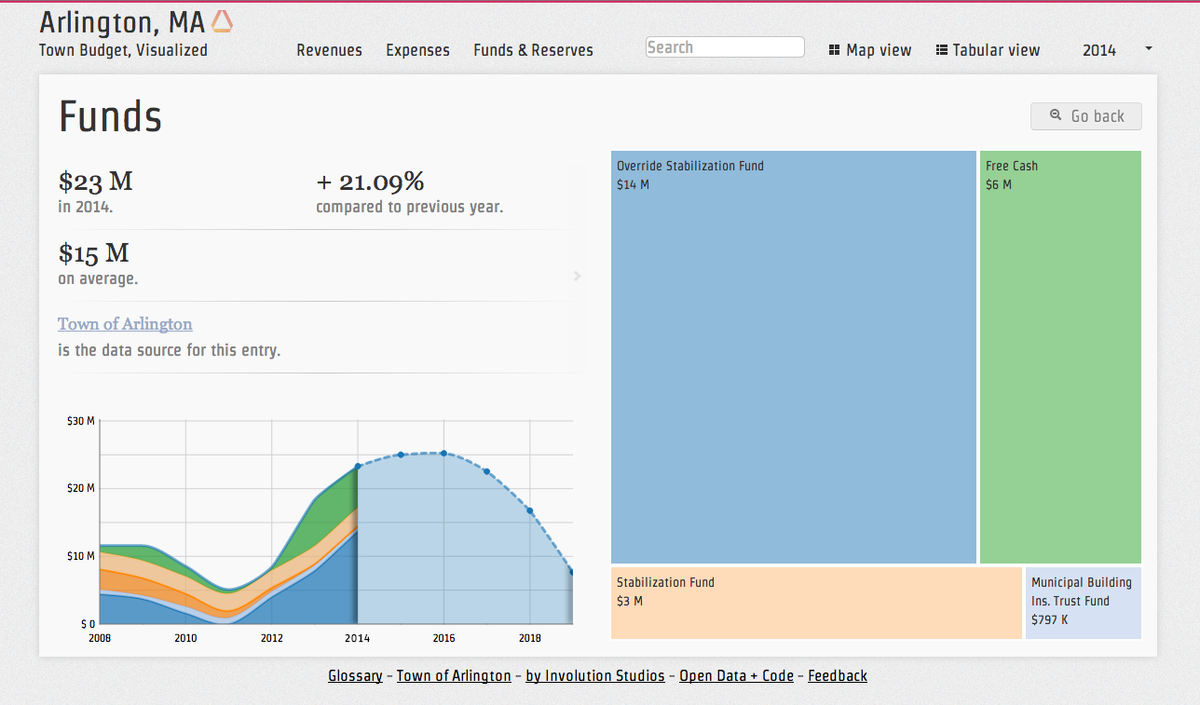
Arlington Visual Budget (AVB) launched at a town hall on September 21, 2013. When the Arlington staff first saw their familiar data rendered in the new form, the reaction was immediate: they stopped engaging with the numbers as financial planners and started exploring as curious citizens.
AVB did more than present figures. It provided plain-language definitions for complex municipal concepts — terms like "Override Stabilization Fund" and "MWRA Debt Shift" that had previously been opaque to most residents. It also displayed historical financial trends, giving context to each annual budget cycle.
The full codebase was released as open source under the Apache 2 license — a deliberate choice that reflected GoInvo's belief that this kind of transparency infrastructure belonged to everyone, not to any one vendor.
Impact & Recognition
From one town to a movement
The response exceeded expectations. At the 2014 Massachusetts Municipal Association (MMA) Annual Meeting, keynote speaker and futurist Mike Walsh singled out Arlington Visual Budget as "the best thing he'd ever seen." Town Manager Adam Chapdelaine demonstrated the tool at the Mass Selectmen's Association annual meeting, where it was again well received.
Finance Committee members Annie LaCourt and Alan Jones became co-founders of VisGov (Visual Government), a working group that grew directly from the project. With diverse backgrounds spanning technology, software engineering, user experience, and municipal finance, VisGov continued refining and distributing the platform. The State of Massachusetts awarded the pair a $40,000 grant to evolve the tool into embeddable interactive visualizations for any municipality's website.
Towns across Massachusetts and beyond adopted and adapted the open-source codebase:
- Arlington, MA
- Mansfield, MA
- Newburyport, MA
- Melrose, MA
- Cohasset, MA
- Bourne, MA
- Asheville, NC
- + 8 more
Awards
- Design F Award
- Innovation Award by Mass Municipal Association
- Voice of Transparency Government - The Sunlight Foundation
What this project taught us
Arlington Visual Budget challenged a core assumption baked into most design education: that good design means centering the user above all else. On this project, the data itself had to be treated as a participant. The numbers had structure, scale relationships, and narrative, and any design that ignored those properties in favor of user-facing elegance would ultimately fail both.
The project also demonstrated what civic technology can look like when a studio donates its expertise. GoInvo contributed design and engineering time at no cost to the town, and in return, the community gained a tool that genuinely changed how residents related to their own government. The open-source release ensured the work continued to deliver long after the original engagement ended.
Elected officials and city and town financial managers see the need to be more transparent. Visual Budget is a great tool to add to their toolbox — they appreciate that we understand their pain.
Annie LaCourt
Arlington Finance Committee & VisGov Co-Founder
This kind of work — technically demanding, grounded in real civic problems, donated in the spirit of public responsibility — is what GoInvo means when it talks about design as a civic act.
Municipalities adopted AVB
Major design awards
State grant awarded


